
2.5×
More precise on cash theft
Of the cash-theft cases the team opened, two and a half times as many were confirmed as real.
StoreTwin · Store analytics & optimisation
StoreTwin harnesses data across the infrastructure you already own into a live data ecosystems and recommend how you can optimise sales, planogram, and stock management.
312shoppers browsed and left without buying — ฿46,800 unconverted
Stock, shoppers and shelf plans become one data set per store, then analytics you can act on. Everything here reads at group level and identifies nobody.
Footfall is read per branch, per hour and across the year, so staffing, promotions and shelf depth follow the pattern of that store instead of a group average.
| 08 | 10 | 12 | 14 | 16 | 18 | 20 | 22 | |
|---|---|---|---|---|---|---|---|---|
| 1091 Talat | 08h: 22 | 10h: 34 | 12h: 62 | 14h: 44 | 16h: 51 | 18h: 88 | 20h: 96 | 22h: 40 |
| 0447 Sathon | 08h: 48 | 10h: 72 | 12h: 94 | 14h: 55 | 16h: 42 | 18h: 60 | 20h: 52 | 22h: 20 |
| 1220 Rangsit | 08h: 16 | 10h: 24 | 12h: 40 | 14h: 36 | 16h: 58 | 18h: 82 | 20h: 90 | 22h: 62 |
| 0863 Hua Hin | 08h: 30 | 10h: 42 | 12h: 50 | 14h: 62 | 16h: 74 | 18h: 70 | 20h: 55 | 22h: 28 |
| 1502 Khon Kaen | 08h: 20 | 10h: 30 | 12h: 46 | 14h: 34 | 16h: 40 | 18h: 66 | 20h: 72 | 22h: 34 |
December runs 1.6x January here, and the peak hour shifts two hours later in the rainy season. Range and roster follow it.
Illustrative example: the same plan of store 1091, with a different read laid over it. Pick one.
Plan drawn from the store's own camera coverage.
Planogram & SKU
Each bay is read against your planogram at SKU level, so a product in the wrong place, a line below its minimum or a bay losing share of shelf shows up without anyone walking the aisle.
One data layer per store, built on the cameras you already have and the same engine as Z-Fraud.
See the case studyOne live deployment, in the client's own numbers: where they started, what we put in, and what changed on the shop floor.
Live deployment · convenience retail · Thailand
A major Thai convenience store chain knew roughly what it was losing every year. What it could not do was find those losses inside the footage: thousands of stores, a security team of a few dozen, and no way to tell which minute of which camera mattered.
Z-Fraud is now expanding store by store across the chain, reading every transaction against the video of that transaction. In each store that goes live, reviewers open a ranked list each morning instead of searching tape.
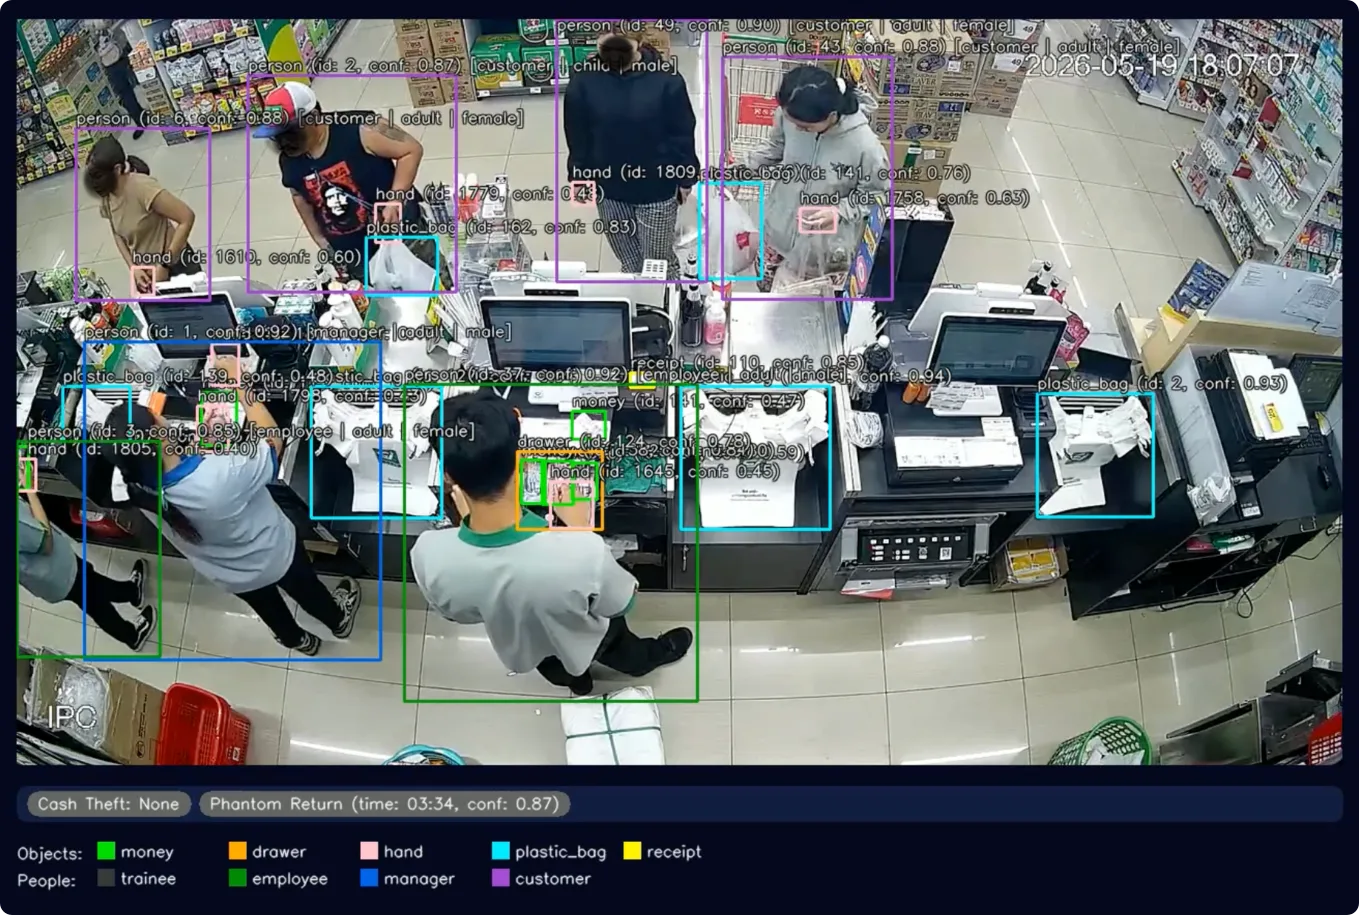
Measured against the same security team's own case list before deployment.
2.5×
Of the cash-theft cases the team opened, two and a half times as many were confirmed as real.
11×
Refund and return cases are where the gap between video and receipt is widest, and where the models gained the most.
We read their existing cameras and told them which angles gave a usable read before anything was committed. Some of those cameras were over a decade old.
There is no one-size-fits-all. Our forward-deployed team worked with their loss prevention leads to define the key incidents, then built the data foundation and train the models against proprietary footage.
Everything runs inside their own estate. The security team opens each flagged event with its footage and its receipt already lined up, confirms it, and closes it.
More detail on the estate, the rollout order and the internal reporting is being added to this page. Ask us for the full write-up in the meantime.